New
This Trend Has Important Implications For Social Security’s Full Retirement Age
New data show strong relationship between earnings and life expectancy.
As part of its review of a recent proposal, the Social Security actuaries provided another contribution to the extensive body of evidence showing that life expectancy is positively related to income and that the gap between those at the top and the bottom of the income distribution has increased over time. This pattern is of crucial importance when considering the progressivity of the Social Security program and any proposal to increase the program’s full retirement age.
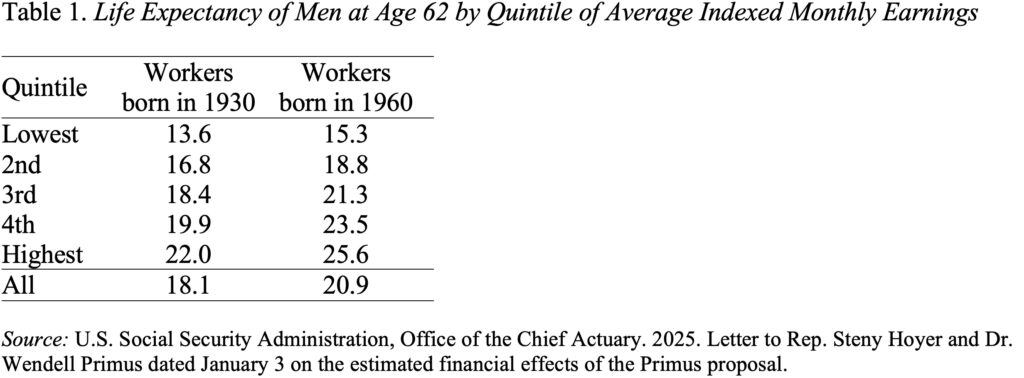
The numbers released by Social Security are based on the records of all workers – not sample populations as in most other studies, but are not as spectacular as results reported by other researchers for a couple of reasons. First, these calculations exclude all workers who received benefits under the disability insurance program – a low-earning group with low life expectancy who would have reduced the bottom quintile estimate even more. Second, unlike earlier studies that looked at life expectancy at age 50, these numbers pertain to life expectancy at age 62; eliminating those who die between 50 and 62 produces a healthier group overall. Despite these positive biases, the pattern remains (see Table 1). Life expectancy rises systematically with earnings, and the gap has been widening.
This pattern has important implications for the progressivity of the Social Security system. A key goal of the program is to redistribute income from high earners to low earners through a progressive benefit formula that replaces a higher percentage of low earnings. The gap in life expectancy undermines that effort because low earners receive benefits for 10 years less than high earners.
The relationship between life expectancy and earnings also has important implications regarding proposals to increase the full retirement age in response to the overall increase in longevity. Yes, life expectancy has increased overall from 18.1 years for men born in 1930 to 20.9 years for men born in 1960. But the gains for the top 20 percent were more than twice as great as those for the bottom 20 percent, and the difference between the two groups increased so that men in the top now can be expected to live 10 years longer than men at the bottom (see Figure 1). That is, men in the bottom 20 percent of the earnings distribution are expected to live to about 77, whereas men in the top are projected to live to about 88.
Because of this huge discrepancy in life expectancy, I really like Wendell Primus’ proposal to increase the full retirement age only for those who can really work longer. Under the plan scored by the actuaries, only the top 20 percent of each cohort would see an increase in the retirement age to 70, gradually phased in over time. Those with earnings below the 60th percentile would see no change. For those with earnings between the 60th and 80th percentiles, the increase would be scaled.
Not only would this sensible change in the full retirement age eliminate 16 percent of the 75-year deficit, it would also restore some power to the progressive benefit formula by helping to equalize the period over which low and high earners receive benefits.
The question that remains in my mind relates to the mechanics. People need some warning about the age at which they can claim full benefits. If the calculation of expected lifetime earnings were done at age 50, would that provide an accurate projection? Would age 55 be better? What type of worker might be miscategorized? This proposal needs a little fleshing out, but it has promise.